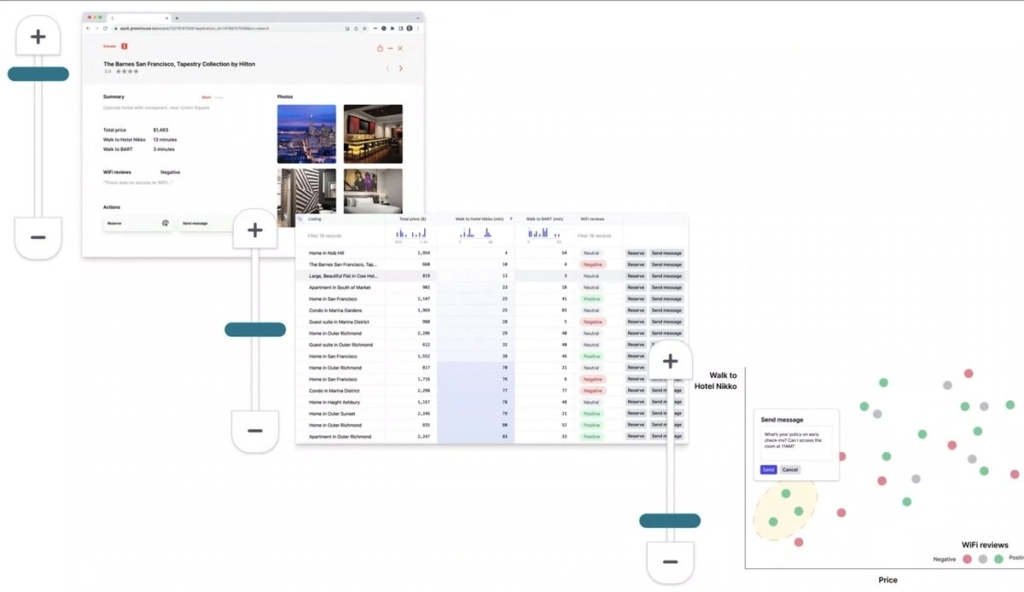
Wattenberger frequently breaks my brain with some of their incredibly well-reasoned and unique ideas, and this talk from AI Engineer Summit is no exception. The core ideas being introduced are around how we can infuse UIs with AI in order to create new models of data capture which could automate and streamline a whole new set of tasks. I particularly love the way spreadsheets are used as a prime example of a UI that has fundamentally reinvented entire market sectors but which we never see as wholly invasive or problematic, just a useful tool that can help bring order through structure. Why not use AI to apply the same approach to non-numeric data sources?
- Workflow augmentation starts with automation. Even within Excel, most of the power is in automated and scripting away the tedious calculations necessary to build the flashy dashboards and data visualisations which help us highlight the key data we're interested in.
- Data is often most useful when you can view the different levels of abstraction in an interlinked way. Amelia uses Google Maps to highlight this very well: as you zoom in or out the relevant data points change, and information is hidden or displayed in different orders to prioritise the most likely use-case at a given zoom level.
- What if we could do the same with any kind of data? Zoom in or out at a whim. There are a few examples given. The first is summarisation of text, e.g. a book. If you open a book at the lowest level of abstraction, well, that's what we're all used to. Perhaps the highest level of abstraction is the contents page, index, or maybe the blurb. But in between those there are other levels that LLMs can now access. Want to summarise each paragraph into a sentence to scan-read a plot? Or zoom out a bit further and have a one-paragraph summary of each chapter to relay to a friend? And then could you utilise this capability to graph those chapters onto story models, to see whether your plot is following a typical convention or if there are outliers?
- The other example is finding a hotel. We need to compare listings across various sites and likely only care about a certain subset of the data shown. Amelia is most interested in the distance to local transport hubs and a specific conference venue, the overall price of the room, how good the WiFi is, and maybe a few photos just to check it has the amenities they need. How cool would it be to have a UI which allows us to zoom out of a listing page and customise the view. It can scan the reviews for keywords and run sentiment analysis on any that match to determine how good WiFi is, for example. It can scrape data like the price and address from the page, then use open source databases to work out the distance and relative affordability. You end up with a dashboard of just the information you, specifically, need. But why stop there? Once you've ran this analysis on multiple pages, the AI could generate a spreadsheet that lets you quickly compare listings across disparate services and sites. Even more zoomed out and you can see a scatter plot that shows you which hotels score highest on all of your key criteria. And because this is AI driven, even at this level of abstraction you should be able to select a listing and send a question or book it directly, letting the AI automate away the actual process of filling out the booking form for you. 🤯

I find it easy to think about numeric data in terms of spreadsheets, and come up with ways to cluster or show key points of information that way. A UI that could allow for that kind of data capture and interrogation across any digital source would be incredible!
I also really like the idea of these zoom-level based interfaces. It strikes me as something that you could apply to lots of information architectures – digital gardens in particular – and if you combined it with view transitions you could have some really interesting UIs, even without AI.
